PostGIS Raster FTW
I’m not a raster guy. I’ve never been a raster guy. I’m not talking about rasters that are really, you know…photos. I mean the serious raster business with bands and pixel values and grid sizes and map algebra. I don’t do map algebra. I’m not even keen on actual algebra (I don’t believe in performing mathematical operations on letters of the alphabet). That’s for smart, serious GIS people. I’m neither a smart nor serious GIS person. I just like solving problems. I’d probably be an auto mechanic if I wasn’t so dirt-averse.
So when I was presented with a raster analysis project, my natural reaction was abject horror. Basically we have a land classification raster and they wanted to do a vector overlay and produce summary raster information for urban forestry purposes. It wasn’t until the end when I heard “and we want it on the web” that I got interested. Vector-raster overlay and summary raster stats with response times measured in milliseconds? That sounded like a problem. I can get in to problems.
Not being a raster person, I naturally tried converting the raster into a vector.
This, of course, was a complete fail, and I should probably be subjected to a good ‘ol Klingon Shun for having tried it.
I tried a number of tools to get this operation working quickly on the raster as a file. The closest I got was Starspan, a tool just for vector-raster overlays built by the University of California at Davis. It’s the fastest thing I found, but still wasn’t quite fast enough, and slowed down considerably as the size of the vector polygon grew. Plus there was a lot of file io going on - the vector had to be converted to a shapefile (as far as I can tell), and the output had to go to a CSV file, which after being written to disk would then have to be read and processed.
I looked at a number of other things and talked with Doug Newcomb at USFWS, who has forgotten more about rasters than most people will ever know, and he pointed me in the direction of GRASS and an online gap analysis tool. But at this point I was on to PostGIS Raster (formerly WKT Raster).
PostGIS Raster was my first thought when I looked at this project, but I didn’t try it initially because (a) I’ve never been a fan of putting rasters in RDBMS’, and (b) it’s still listed as experimental and I didn’t want to melt the server. After my growing list of fails, I decided to give it a shot.
Getting it up and running on Postgres is easy enough. There are experimental Windows builds, and basically all you need to do is stop Postgres, copy in a couple DLL’s and a Python script to the Postgres folders they’re supposed to go to, and start Postgres. From there you run a SQL script to add the tables, functions, and raster data type, and the server is ready to go. If it takes you more than 5 minutes, you need a new mouse.
The raster loader is a Python script, so you’ll need Python to run it (I used 2.7). You’ll also need GDAL and numpy for Python. You can try to easy_install those, but that requires you to have either VS2008 or MingW set up for C compilation on Windows. It’s easier to grab the binaries from Christoph Gohlke’s site. (Note to self - wget that site in case it goes away).
Now it’s time to run the loading script. Basically this script takes a raster and converts it into a SQL load file, much the way shp2pgsql does for shapefiles.
1 | gdal2wktraster.py -r land_classification_mosaic_2008.tif -t land_classification_2008 -s 2264 -k 50x50 -I > load.sql |
Where -r is the raster (you can do *.tif to load a collection of rasters in a directory), -t is the Postgres table to create, -s is the EPSG code, -k is the tile size, and -I tells it to make a spatial index. This took a 2.7gb tiff (ug) and created a 5gb SQL load file (UG!). From there you just execute the SQL file and watch as an endless parade of insert statements whizzes by on your terminal.
1 | psql -f load.sql your_database_name |
While the 5GB load script made me cringe, Postgres stores the data very efficiently, at least for this type of raster.
1 | # SELECT pg_size_pretty(pg_total_relation_size('land_classification_2008')); |
Now it was a matter of running the SQL query and crossing my fingers. The vector to overlay would be a particular parcel from our Tax Parcels layer, so the query looks something like this:
1 | SELECT |
This yields a record for each pixel value with the total area of that value and the percentage of the vector polygon area with that value. Note the the_geom && rast part. That was left off the tutorials linked from the PostGIS Raster page, and if you don’t do that, your performance will suck. This operation basically limits you to where the MBR of both features intersect, and if you don’t have it in there you’re not taking advantage of your spatial indexes. (Edit: Per Pierre’s comment, this was actually an artifact of the build I was using. You shouldn’t need the && operation in future builds.)
But back to the point of this exercise. For an average size parcel, 150ms. For an enormous (100 acre) parcel, ~350ms. And the server seems to be as happy as a clam.
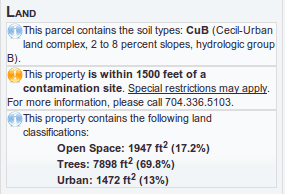
Add a little web service/jQuery magic, and we get item #3 under Land.
PostGIS Raster is great, and it’s set to be included with PostGIS 2.0. I haven’t run into any issues using it right now, and it was the easiest and fastest solution to this raster-vector analysis problem I could find. For the record though, rasters still creep me out.


